A scaling can be represented by a scaling matrix. To scale an object by a vector v = (vx, vy, vz), each point p = (px, py, pz) would need to be multiplied with this scaling matrix:

As shown below, the multiplication will give the expected result:
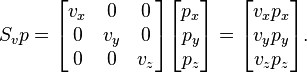
Such a scaling changes the diameter of an object by a factor between the scale factors, the area by a factor between the smallest and the largest product of two scale factors, and the volume by the product of all three.
Program
#include <iostream.h>
#include <conio.h>
#include <graphics.h>
void main()
{
int gd=DETECT,gm;
float x1,y1,x2,y2,sx,sy;
initgraph(&gd,&gm,"C:\\Tc\\BGI");
cout<<"SCALING OF A LINE\n";
cout<<"Enter the first coordinate of a line:";
cin>>x1>>y1;
cout<<"Enter the second coordinate of a line:";
cin>>x2>>y2;
line(x1,y1,x2,y2);
cout<<"Enter the scaling factor:";
cin>>sx>>sy;
setcolor(RED);
x1=x1*sx;
y1=y1*sy;
x2=x2*sx;
y2=y2*sy;
line(x1,y1,x2,y2);
getch();
closegraph();
}

Where is output
ReplyDelete