Showing posts with label C Plus Plus Programs. Show all posts

C++ program to show animated dancing dolls in graphics

#include<dos.h>
#include<iostream.h>
#include<conio.h>
#include<graphics.h>
class doll
{
     public:
void dolldraw(int x)
{
int y=100;
circle(x,y+10,10);
line(x,y+20,x,y+100);
line(x,y+40,x-20,y+70);
line(x,y+40,x+20,y+70);
line(x,y+100,x-20,y+120);
line(x,y+100,x+20,y+120);
}
void dollmoll(int x)
{
int y=100;
circle(x,y+10,10);
line(x,y+20,x,y+100);
line(x,y+50,x-20,y+30);
line(x,y+50,x+20,y+30);
line(x,y+100,x-20,y+90);
line(x,y+100,x+20,y+90);
}

};
void main()
{
doll a,b,c,d,e;
int h,i,j,k;
int gd=DETECT,gm;
initgraph(&gd,&gm,"C:\\TC\\BGI");
int w=50;
while(!kbhit())
{
a.dolldraw(w);
h=w+45;
b.dolldraw(h);
j=h+45;
c.dolldraw(j);
i=j+45;
d.dolldraw(i);
k=i+45;
e.dolldraw(k);
delay(500);
cleardevice();
w=150;
a.dollmoll(w);
b.dollmoll(h);
c.dollmoll(i);
d.dollmoll(j);
e.dollmoll(k);
delay(500);
cleardevice();
}
getch();
closegraph();
}

Read More

C++ Program to show animated pendulum clock in graphics

#include<math.h>
#include<process.h>
#include<dos.h>
#include<iostream.h>
#include<conio.h>
#include<graphics.h>
int x1=300,y1=180,x,y;
void display(double i)
{
circle(300,130,50);
line(210,60,210,320);
line(210,60,390,60);
line(390,60,390,320);
line(210,320,390,320);
outtextxy(295,88,"12");
outtextxy(260,130,"9");
outtextxy(340,130,"3");
outtextxy(295,168,"6");
line(300,130,300,98);
line(300,98,297,101);
line(300,98,303,101);
line(337,130,300,130);
line(337,130,334,127);
line(337,130,334,133);
x=x1+95*cos(i);
y=y1+95*sin(i);
line(x1,y1,x,y);
circle(x,y,10);
delay(30);
clearviewport();
}

void main()
{
int gd=DETECT,gm;
double i;
initgraph(&gd,&gm,"C:\\Tc\\BGI");
while(!kbhit())
{
for(i=2;i>1;i=i-0.01)
display(i);
for(i=1;i<2;i=i+0.01)
display(i);
}
getch();
}
Read More

C++ Program to show animated bouncing ball

Program 
#include<iostream.h>
#include<conio.h>
#include<graphics.h>
#include<dos.h>
void main()
{
clrscr();
int gd=0,gm,x=20,flag=0,y=200,uplimit=250;
initgraph(&gd,&gm,"C:\\Tc\\BGI");
while(!kbhit())
{
setcolor(4);
line(0,400,679,400);
if(flag==0)
{
y+=2;
x+=1;
if(y>=385)
flag=1;
}
if(flag==1)
{
y-=2;
x+=1;
if(y<=uplimit)
{
flag=0;
uplimit+=20;

}
}

setcolor(15);
fillellipse(x,y,15,15);
delay(15);
setcolor(0);
setfillstyle(1,10);
fillellipse(x,y,15,15);
cleardevice();
}

getch();
}
Read More

C++ program to show animated traffic signal (Simple graphics)

#include<iostream.h>
#include<conio.h>
#include<graphics.h>
#include<dos.h>
void main()
{
clrscr();
int gd=0,gm;
initgraph(&gd,&gm,"C:\\Tc\\BGI");
rectangle(250,50,350,350);
circle(300,100,50);
circle(300,200,50);
circle(300,300,50);
line(80,80,80,500);
line(80,80,250,80);

while(!kbhit())
{
int x=100;
setfillstyle(1,RED);
floodfill(x+200,100,WHITE);
delay(500);
setfillstyle(1,BLACK);
floodfill(x+200,100,WHITE);
setfillstyle(1,YELLOW);
floodfill(x+200,200,WHITE);
delay(500);
setfillstyle(1,BLACK);
floodfill(x+200,200,WHITE);
setfillstyle(1,GREEN);
floodfill(x+200,300,WHITE);
delay(300);
setfillstyle(1,BLACK);
floodfill(x+200,300,WHITE);
}

getch();
closegraph();
}

Read More

C++ Program to draw a moving jeep (Simple Graphics)


Program

#include<iostream.h>
#include<conio.h>
#include<graphics.h>
#include<dos.h>
#include<math.h>
#include<stdlib.h>
#include<process.h>
void main()
{
clrscr();
int gd=DETECT,gm;
int x=320;
initgraph(&gd,&gm,"C:\\TC\\BGI");
while(!kbhit())
{
setcolor(RED);
line(x,200,x,290);
line(x,290,x+280,290);
line(x+280,290,x+280,100);
line(x+280,100,x+110,100);
line(x+110,100,x+85,200);
line(x+85,200,x,200);
rectangle(x+250,120,x+200,170);
setcolor(3);
circle(x+60,290,30);
circle(x+210,290,30);
delay(50);
cleardevice();
x=x-3;
}
getch();
closegraph();
}

Read More

C++ program to implement shearing in graphics

A shear is a transformation that distorts the shape of an object along either or both of the axies. Like scale and translate, a shear can be done along just one or along both of the coordinate axes. A shear along one axis (say, the x-axis) is performed in terms of the point's coordinate in the other axis (the y-axis). Thus a shear of 1 in the x-axis will cause the x-coodinate of the point ot distort by 1*(y-coordinate). 

Read More

C++ Program to implement reflection in graphics

Reflection in computer graphics is used to emulate reflective objects like mirrors and shiny surfaces.
Reflection is accomplished in a ray trace renderer by following a ray from the eye to the mirror and then calculating where it bounces from, and continuing the process until no surface is found, or a non-reflective surface is found. Reflection on a shiny surface like wood or tile can add to the photorealistic effects of a 3D rendering.

Read More

C++ Program to implement scaling in graphics

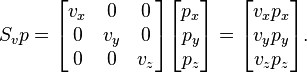
A scaling can be represented by a scaling matrix. To scale an object by a vector v = (vx, vy, vz), each point p = (px, py, pz) would need to be multiplied with this scaling matrix:
 S_v = 
\begin{bmatrix}
v_x & 0 & 0  \\
0 & v_y & 0  \\
0 & 0 & v_z  \\
\end{bmatrix}.
As shown below, the multiplication will give the expected result:

S_vp =
\begin{bmatrix}
v_x & 0 & 0  \\
0 & v_y & 0  \\
0 & 0 & v_z  \\
\end{bmatrix}
\begin{bmatrix}
p_x \\ p_y \\ p_z 
\end{bmatrix}
=
\begin{bmatrix}
v_xp_x \\ v_yp_y \\ v_zp_z
\end{bmatrix}.
Such a scaling changes the diameter of an object by a factor between the scale factors, the area by a factor between the smallest and the largest product of two scale factors, and the volume by the product of all three.

Program

#include <iostream.h>
#include <conio.h>
#include <graphics.h>
void main()
{
int gd=DETECT,gm;
float x1,y1,x2,y2,sx,sy;
initgraph(&gd,&gm,"C:\\Tc\\BGI");
cout<<"SCALING OF A LINE\n";
cout<<"Enter the first coordinate of a line:";
cin>>x1>>y1;
cout<<"Enter the second coordinate of a line:";
cin>>x2>>y2;
line(x1,y1,x2,y2);
cout<<"Enter the scaling factor:";
cin>>sx>>sy;
setcolor(RED);
x1=x1*sx;
y1=y1*sy;
x2=x2*sx;
y2=y2*sy;
line(x1,y1,x2,y2);
getch();
closegraph();
}

Read More

C++ Program to implement rotation in graphics

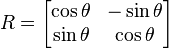
In linear algebra, a rotation matrix is a matrix that is used to perform a rotation in Euclidean space. For example the matrix
R = 
\begin{bmatrix}
\cos \theta & -\sin \theta \\
\sin \theta & \cos \theta \\
\end{bmatrix}
rotates points in the xy-Cartesian plane counterclockwise through an angle θ about the origin of the Cartesian coordinate system. To perform the rotation using a rotation matrixR, the position of each point must be represented by a column vector v, containing the coordinates of the point. A rotated vector is obtained by using the matrix multiplication Rv. Since matrix multiplication has no effect on the zero vector (i.e., on the coordinates of the origin), rotation matrices can only be used to describe rotations about the origin of the coordinate system.

Program

#include <math.h>
#include <iostream.h>
#include <conio.h>
#include <graphics.h>
void main()
{
int gd=DETECT,gm,x1,x2,y1,y2,x4,y4;
initgraph(&gd,&gm,"C:\\Tc\\BGI");
float angle=0,ang;
cout<<"\nROTATION OF A LINE\n";
cout<<"Enter the first coordinate of a line:";
cin>>x1>>y1;
cout<<"Enter the second coordinate of a line:";
cin>>x2>>y2;
line(x1,y1,x2,y2);
cout<<"Enter the angle:";
cin>>ang;
angle=(ang*3.14)⁄180;
setcolor(RED);
x4=x2-(((x2-x1)*cos(angle))-((y2-y1)+sin(angle)));
y4=y2-(((x2-x1)*sin(angle))+((y2-y1)*cos(angle)));
line(x2,y2,x4,y4);
getch();
closegraph();
}

Read More

C++ Program to implement translation in graphics

 A translation is an affine transformation but not a linear transformationhomogeneous coordinates are normally used to represent the translation operator by a matrix and thus to make it linear. Thus we write the 3-dimensional vector w = (wxwywz) using 4 homogeneous coordinates as 
w = (wxwywz, 1).[1]

Program

#include <iostream.h>
#include <conio.h>
#include <graphics.h>
void main()
{
int gd=DETECT,gm,x1,x2,y1,y2,tx,ty;
initgraph(&gd,&gm,"C:\\Tc\\BGI");
cout<<"Enter the first co-ordinate of a line:";
cin>>x1>>y1;
cout<<"Enter the second co-ordinate of a line:";
cin>>x2>>y2;
line(x1,y1,x2,y2);
cout<<"Enter the translation vector:";
cin>>tx>>ty;
setcolor(RED);
x1=x1+tx;
y1=y1+ty;
x2=x2+tx;
y2=y2+ty;
line(x1,y1,x2,y2);
getch();
closegraph();
}

Read More

C++ Program to implement boundary fill algorithm

Start at a point inside the figure and paint with a particular color. Filling continues until a boundarycolor is encountered. Thjere are two ways to do this: 

Programs

#include <iostream.h>
#include <conio.h>
#include <graphics.h>
#include <dos.h>

void bfill(int x,int y,int fill,int border)
{
if((getpixel(x,y)!=border)&&(getpixel(x,y)!=fill))
{
delay(8);
putpixel(x,y,fill);

bfill(x+1, y,fill,border);
        bfill(x, y+1,fill,border);
        bfill(x-1, y,fill,border);
        bfill(x, y-1,fill,border);        
}
}
void main()
{
int gd=DETECT,gm;
initgraph(&gd,&gm,"C:\\Tc\\BGI");
rectangle(10,50,50,10);
bfill(11,12,MAGENTA,WHITE);
getch();
closegraph();
}

Read More

C++ Program to implement flood fill algorithm (graphics)

Flood fill, also called seed fill, is an algorithm that determines the area connected to a given node in a multi-dimensional array. It is used in the "bucket" fill tool of paint programs to fill connected, similarly-colored areas with a different color, and in games such as Go and Minesweeper for determining which pieces are cleared. When applied on an image to fill a particular bounded area with color, it is also known as boundary fill.

Program

#include <iostream.h>
#include <conio.h>
#include <graphics.h>
#include <dos.h>
void ffill(int x,int y,int fill,int old)
{
if((getpixel(x,y)!=old)&&(getpixel(x,y)!=fill))
{
delay(8);
putpixel(x,y,fill);
ffill(x+1,y,fill,old);
ffill(x-1,y,fill,old);
ffill(x,y+1,fill,old);
ffill(x,y-1,fill,old);
}
}
void main()
{
int gd=DETECT,gm;
initgraph(&gd,&gm,"C:\\Tc\\BGI");
rectangle(10,50,50,10);
ffill(15,30,MAGENTA,WHITE);
getch();
closegraph();
}

Read More

C++ Program to implement Bresenham's circle algorithm (Graphics)

In computer graphics, the midpoint circle algorithm is an algorithm used to determine the points needed for drawing a circle. Bresenham's circle algorithm is derived from the midpoint circle algorithm. The algorithm can be generalized to conic sections.[1]

Program

#include <iostream.h>
#include <graphics.h>
#include <conio.h>
#include <dos.h>
void circlebres(float x1,float y1,float r)
{
float x,y,p;
x=0;
y=r;
p=3-(2*r);
while(x<=y)
{
putpixel(x1+x,y1+y,WHITE);
putpixel(x1-x,y1+y,WHITE);
putpixel(x1+x,y1-y,WHITE);
putpixel(x1-x,y1-y,WHITE);
putpixel(x1+y,y1+x,WHITE);
putpixel(x1+y,y1-x,WHITE);
putpixel(x1-y,y1+x,WHITE);
putpixel(x1-y,y1-x,WHITE);
x=x+1;
if(p<0)
{
p=p+4*(x)+6;
}
else
{
p=p+4*(x-y)+10;
y=y-1;


}
delay(20);

}
}
void main()
{
float x1,y1,r;
int gd=DETECT,gm;
initgraph(&gd,&gm,"C:\\Tc\\BGI");
cout<<"Enter the starting co-ordinates of a center:";
cin>>x1>>y1;
cout<<"Enter the value of radius:";
cin>>r;
circlebres(x1,y1,r);
getch();
closegraph();
}

Read More

C++ Program to implement Bresenham's line algorithm (Graphics)

Bresenham's line algorithm is an algorithm that determines the points of an n-dimensional raster that should be selected in order to form a close approximation to a straight line between two points. It is commonly used to draw lines on a computer screen, as it uses only integer addition, subtraction and bit shifting, all of which are very cheap operations in standard computer architectures. It is one of the earliest algorithms developed in the field of computer graphics. An extension to the original algorithm may be used for drawing circles.


Program

#include <iostream.h>
#include <conio.h>
#include <graphics.h>
#include<dos.h>
void bsline(int x,int y,int x2,int y2)
{
int dx,dy,p;
dx=x2-x;
dy=y2-y;
p = 2 * (dy) - (dx);
while(x <= x2)
{
if(p < 0)
{
x=x+1;
y=y;
p = p + 2 * (dy);
}
else
{
x=x+1;
y=y+1;
p = p + 2 * (dy - dx);
}
putpixel(x,y,RED);
delay(10);
}
}
void main()
{
int gd=DETECT,gm;
initgraph(&gd,&gm,"C:\\Tc\\BGI");
int x1,x2,y1,y2;
cout<<"Enter the x1,y1,x2,y2 values : ";
cin>>x1>>y1>>x2>>y2;
bsline(x1,y1,x2,y2);
getch();
closegraph();
}

Read More

C++ Program to implement Digital differential analyzer (DDA graphics algorithm)

In computer graphics, a digital differential analyzer (DDA) is hardware or software used for linear interpolation of variables over an interval between start and end point. DDAs are used for rasterization of lines, triangles and polygons. In its simplest implementation, the DDA algorithm interpolates values in interval by computing for each xi the equations xi = xi−1+1/m, yi = yi−1 + m, where Δx = xend − xstart and Δy = yend − ystart and m = Δy/Δx

Program

#include <iostream.h>
#include <conio.h>
#include <graphics.h>
#include <math.h>
#include <process.h>
void main()
{
float i,x1,x2,y1,y2,dx,dy,x,y,step,xinr,yinr;
int gd=DETECT,gm;
clrscr();
initgraph(&gd,&gm,"C:\\Tc\\BGI");
cout<<"Enter the values\n";
cin>>x1>>y1>>x2>>y2;
dx=x2-x1;
dy=y2-y1;
if(dx==0&&dy==0)
{
putpixel(x1,y1,15);
getch();
exit(0);
}
if(abs(dx)>=abs(dy))
step=abs(dx);
else
step=abs(dy);
xinr=dx⁄step;
yinr=dy⁄step;
x=x1;
y=y1;
for(i=1;i<=step;i++)
{
putpixel(x,y,15);
x=x+xinr;
y=y+yinr;
}
getch();
closegraph();
}

Read More